

Questions
Frequently asked questions
Can’t find the answer you’re looking for? Feel free to contact us
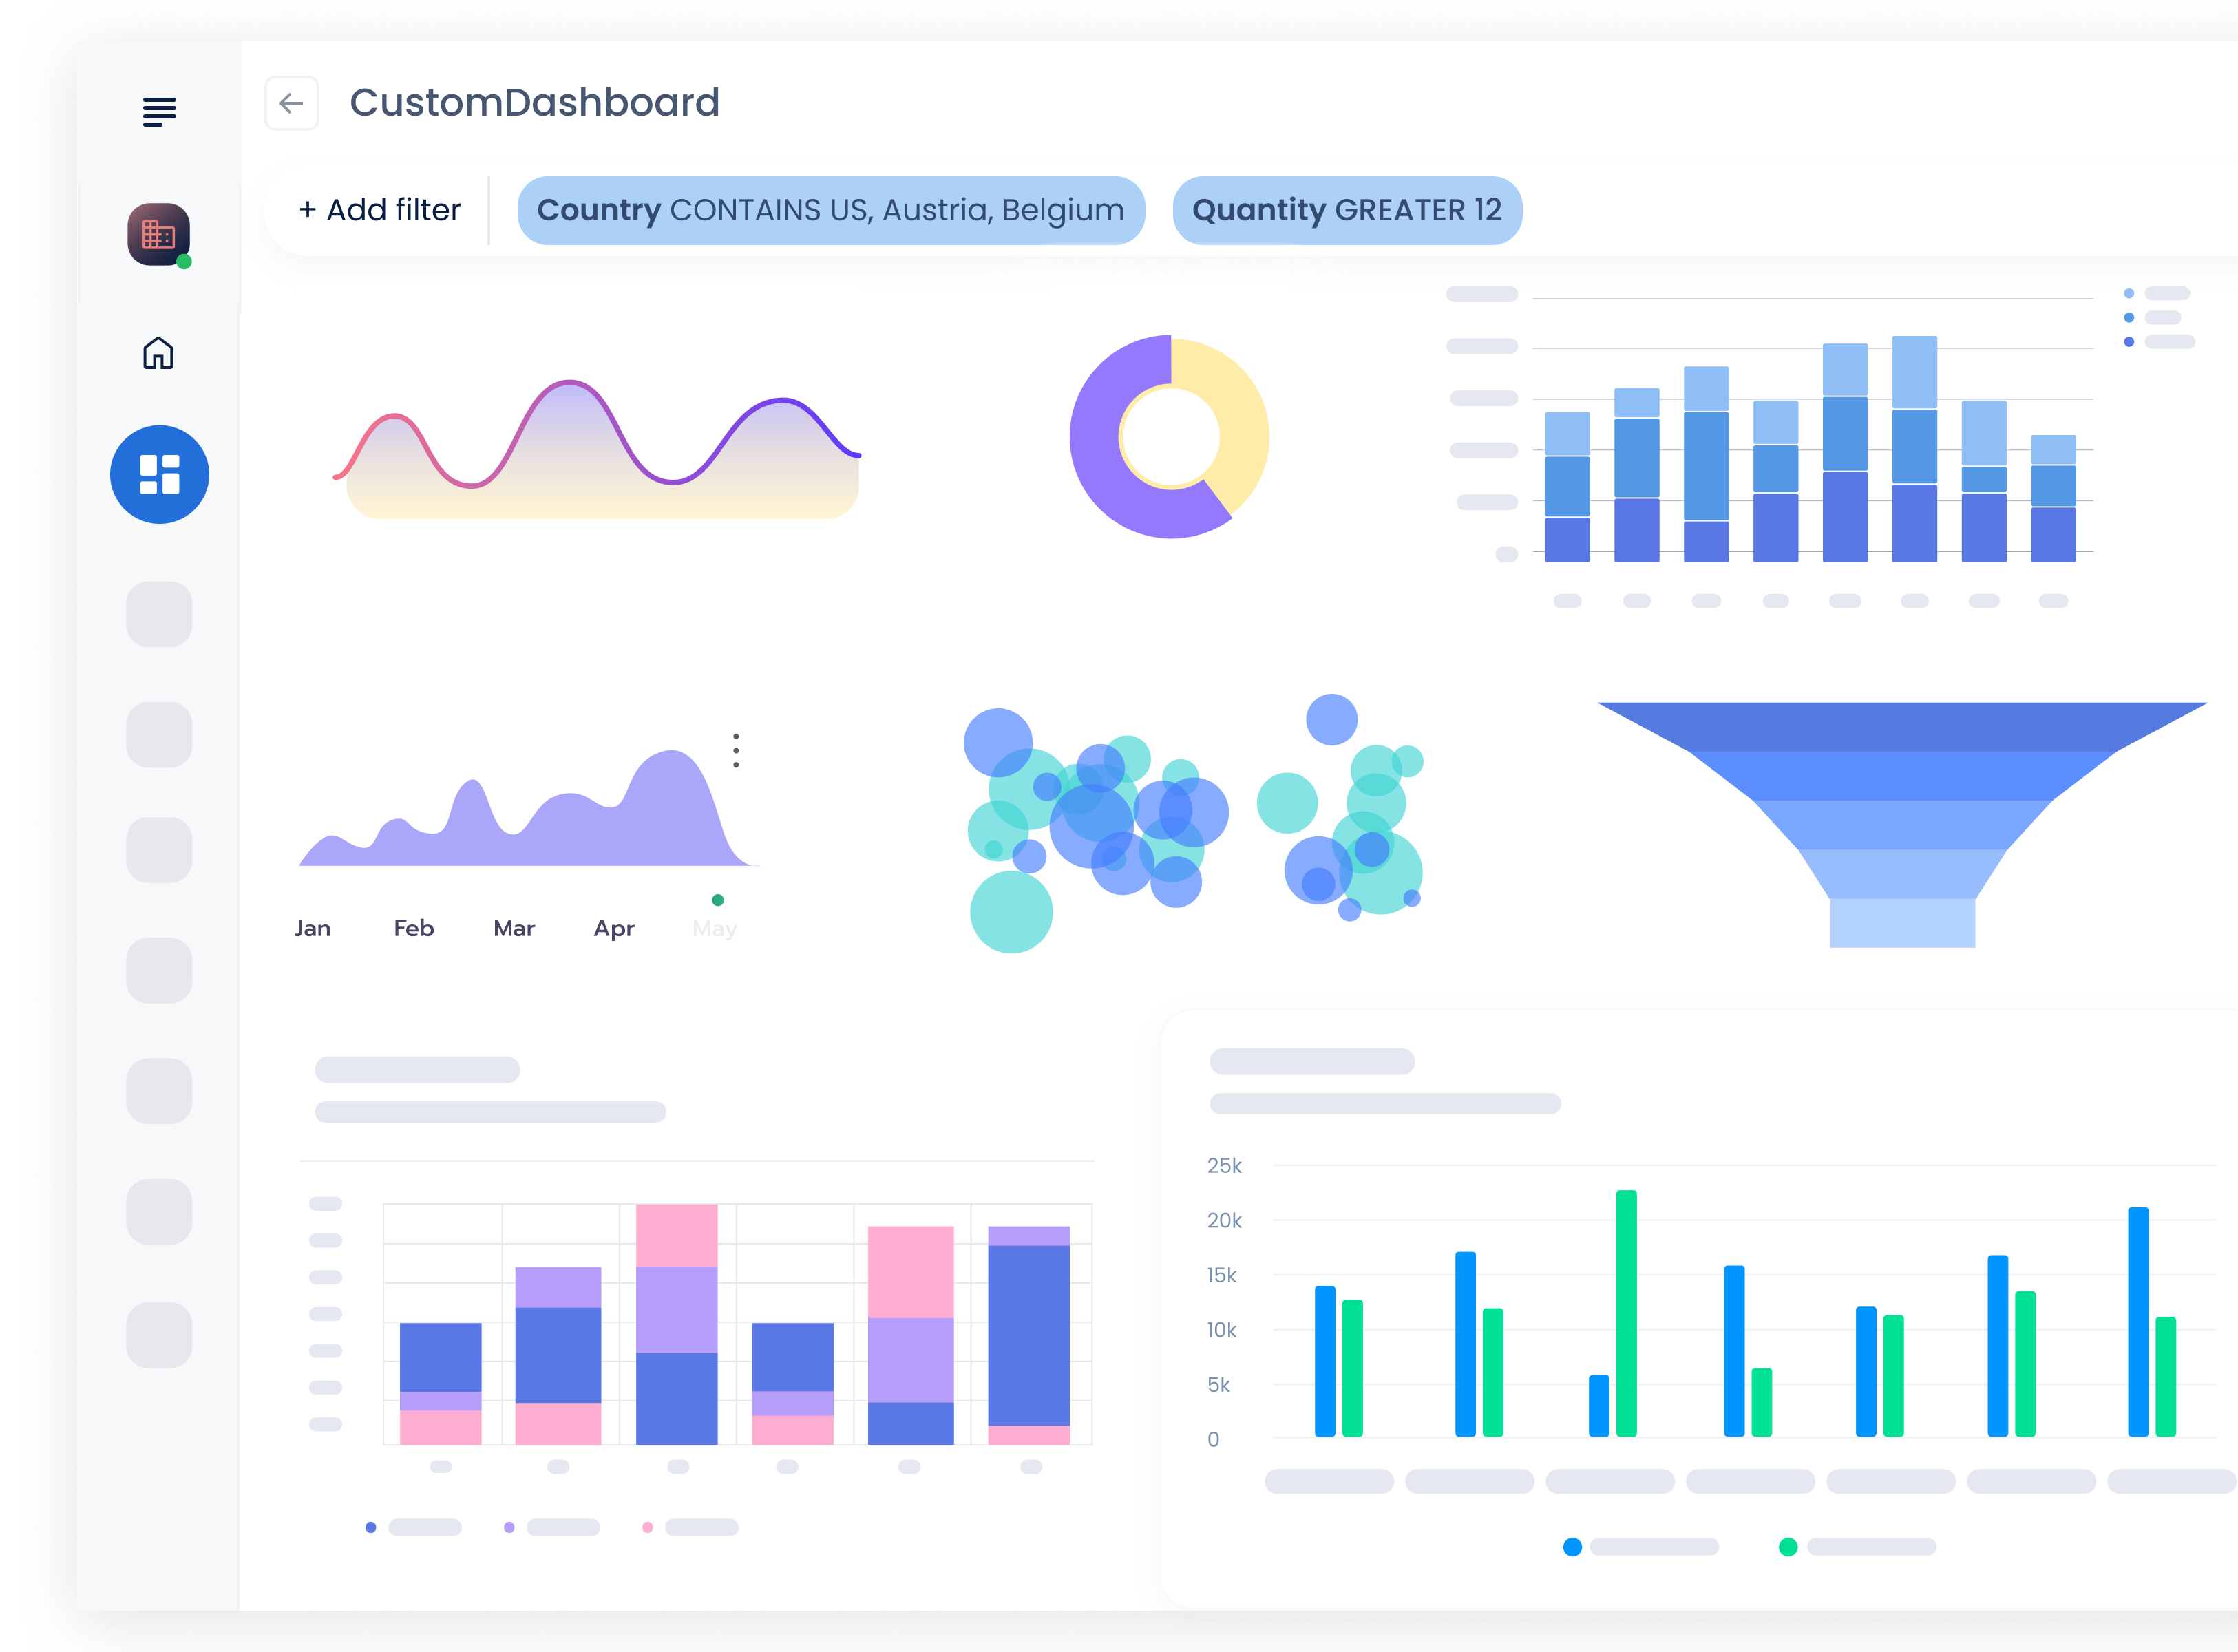
What types of visualizations can I use in Sprinkle?
How much can i customise my dashboards?
Can I customise the appearance of my visualisations?
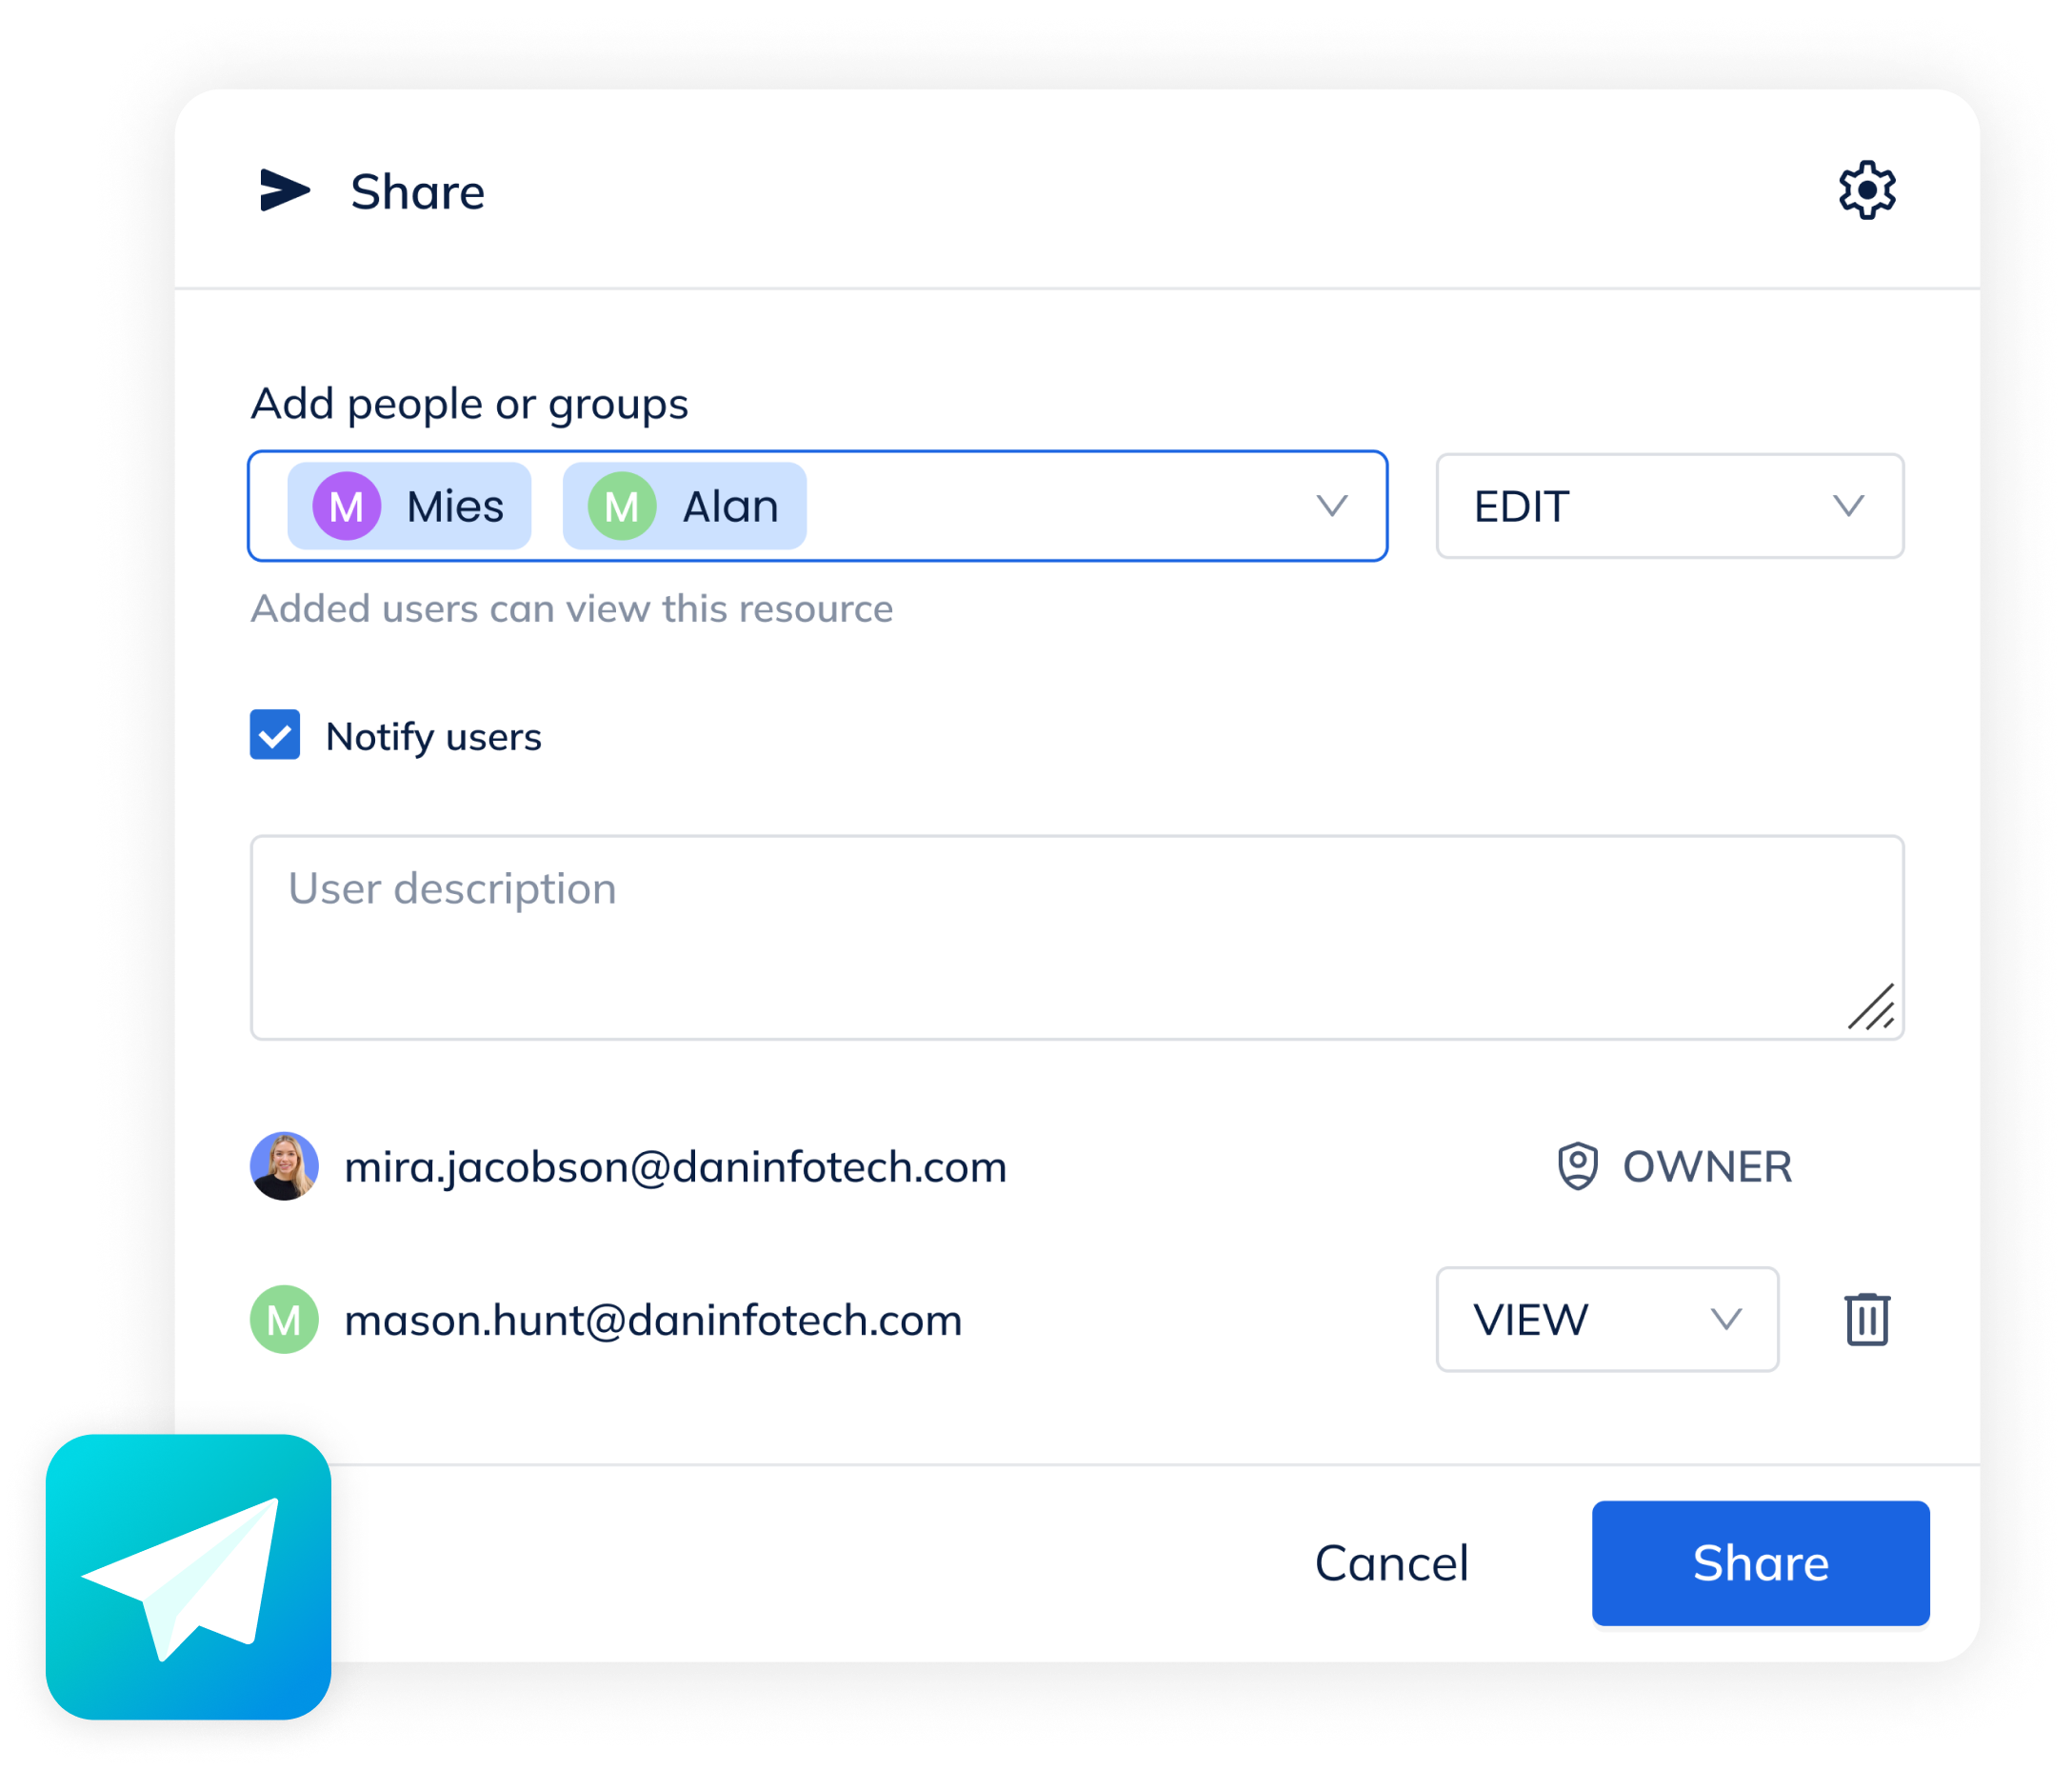
Can I schedule report delivery?